Key Quality Parameters

Top-level specifications for hyperspectral imaging systems (such as number of spatial pixels, number of spectral bands, F#, frame rate, weight, and dimensions) may, at first sight, seem trivial to compare. However, as in the case of consumer cameras in which the number of megapixels, F# and focal length do not tell you very much about how well the system actually performs, the previously mentioned top-level specifications are insufficient to thoroughly describe a hyperspectral system.
This section describes several performance parameters and considerations to take into account when comparing seemingly similar systems.
Welcome to HySchool.
High Dimensional Beasts and How to Capture Them
Joe Boardman: The Four Hurdles of Imaging Spectroscopy
Joe Boardman: Geometric Characterization
Joe Boardman: Geometric Characterization
The Importance of High Spectral Fidelity
Key Quality Parameters
Key Performance Parameters


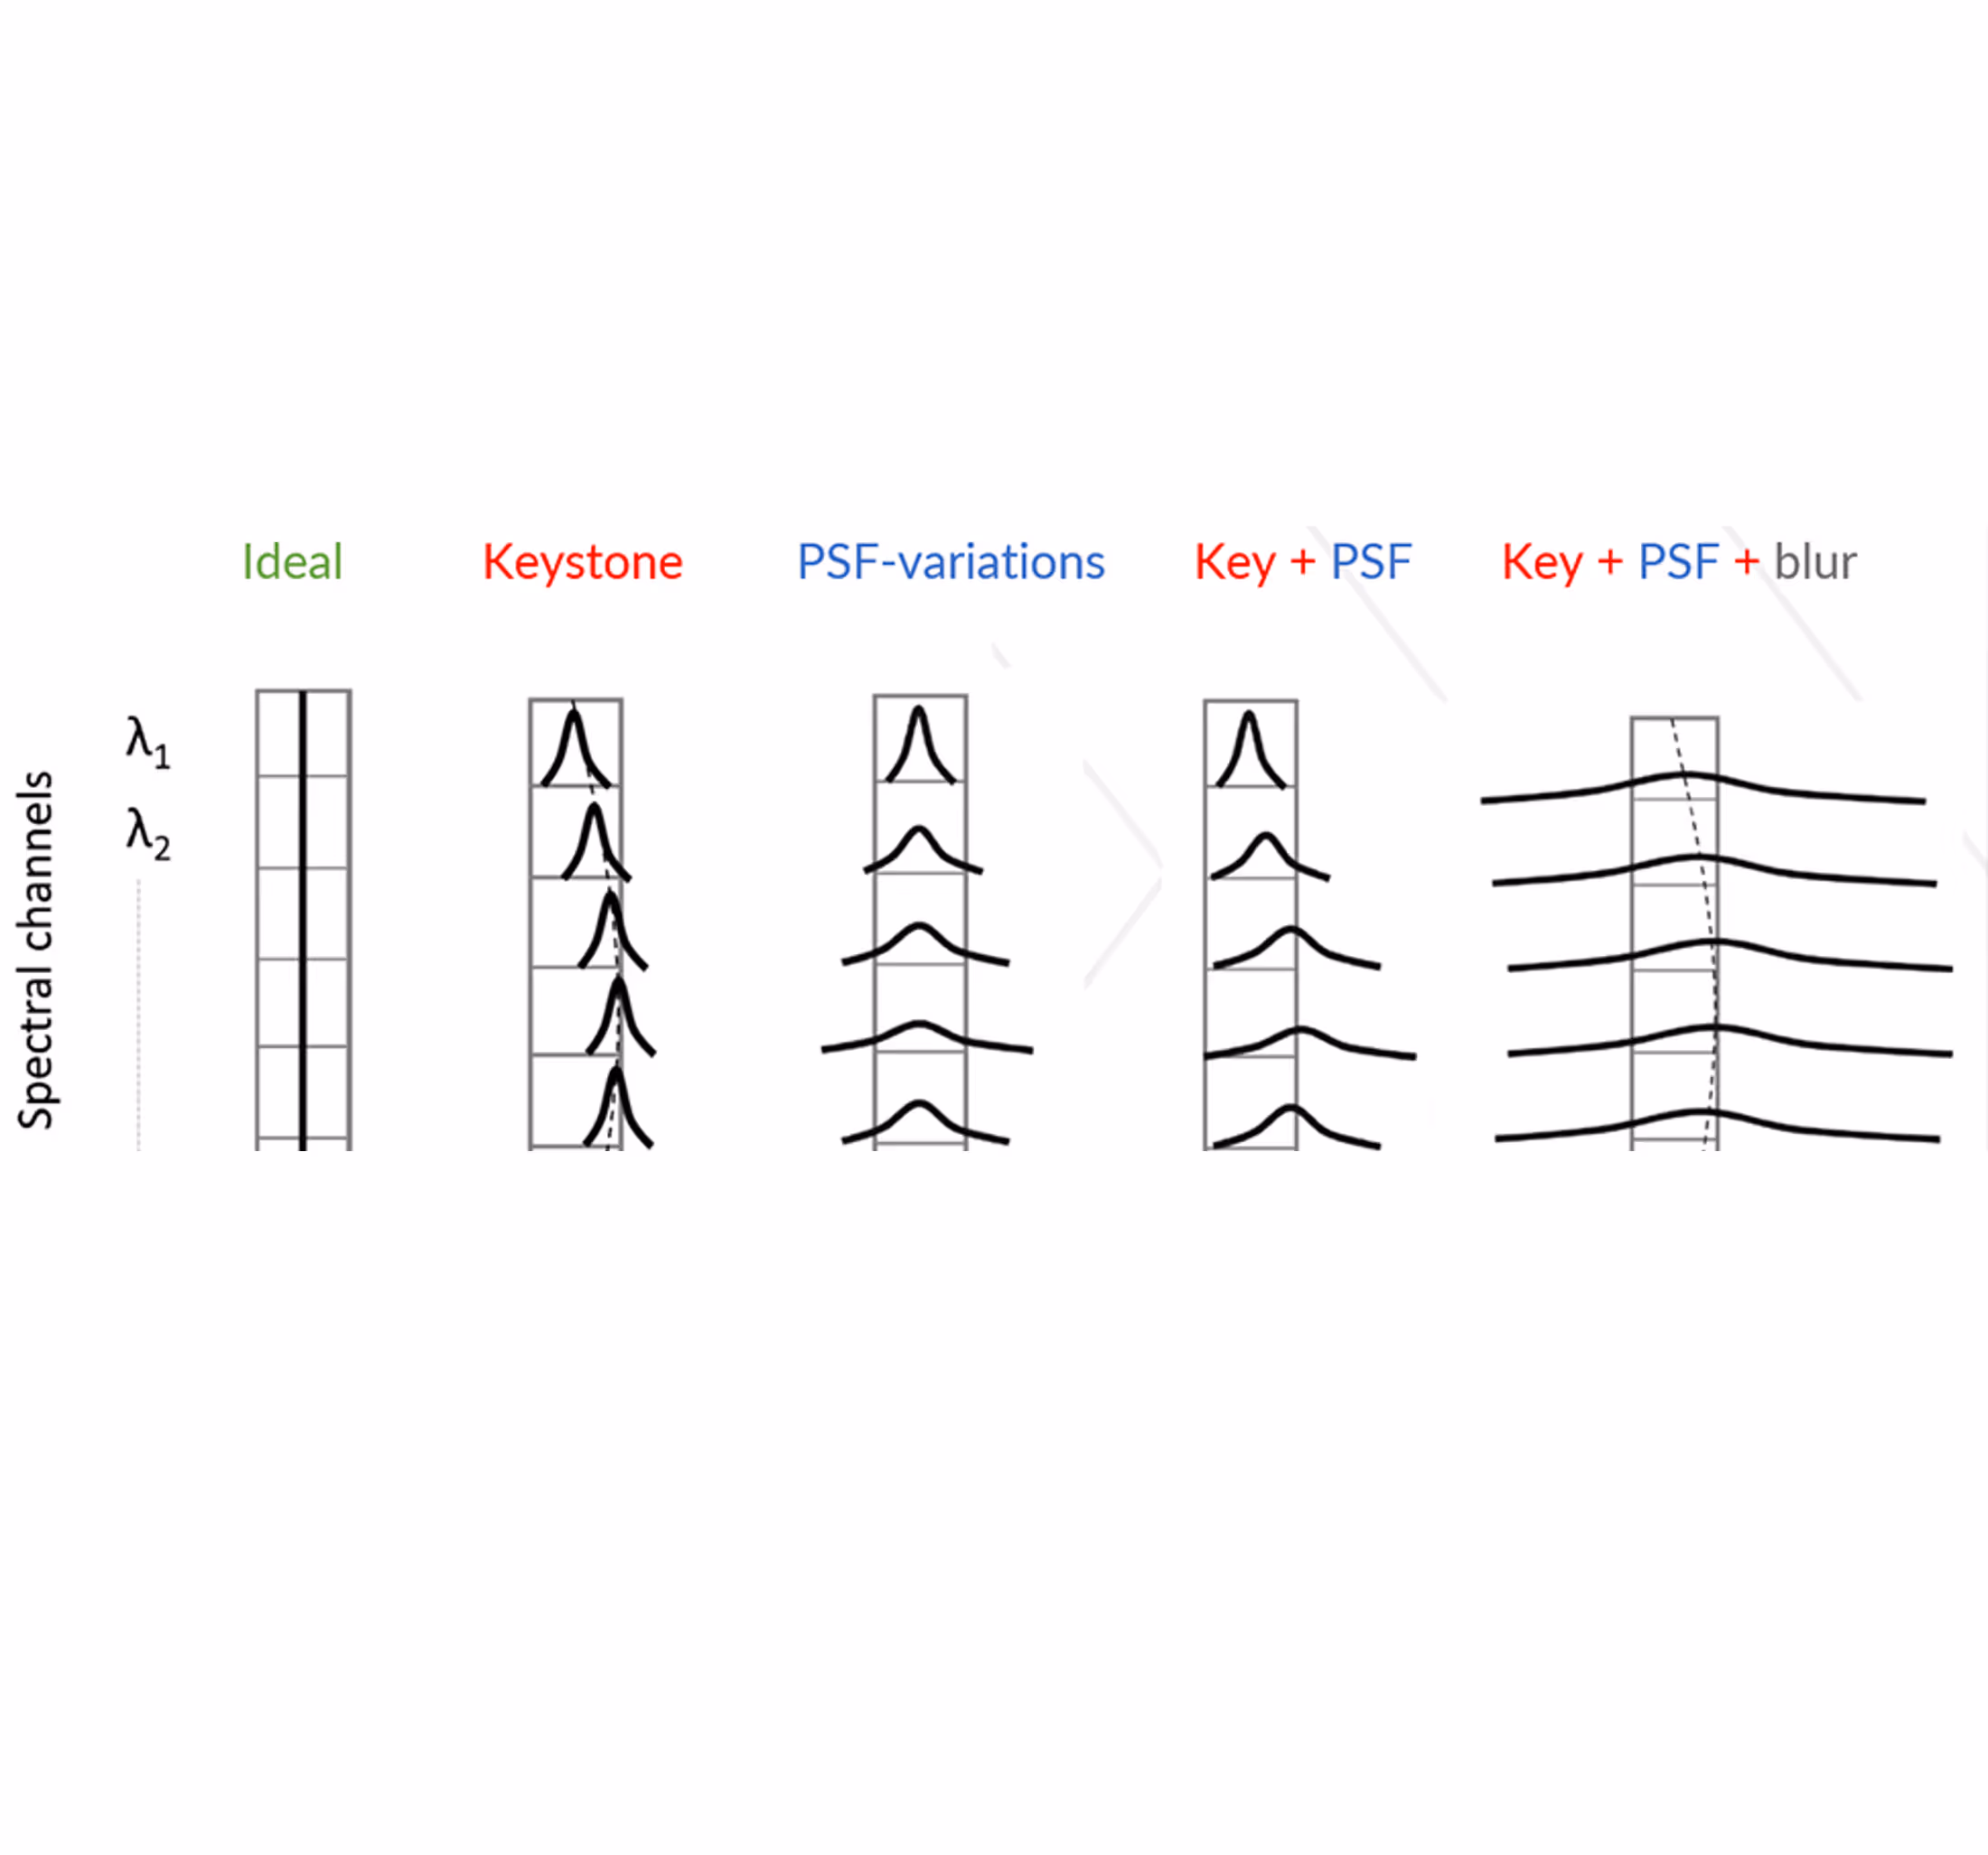
Sharp optics per pixel or many pixels per PSF
There are extremely many reasons for making sharp optics per pixel and per band. For any given detector, with a given detector pitch, you will always get more information out of your imaging spectrometer with sharp optics (fact 1). Therefore, our current line of hyperspectral cameras is really sharp spectrally and spatially.
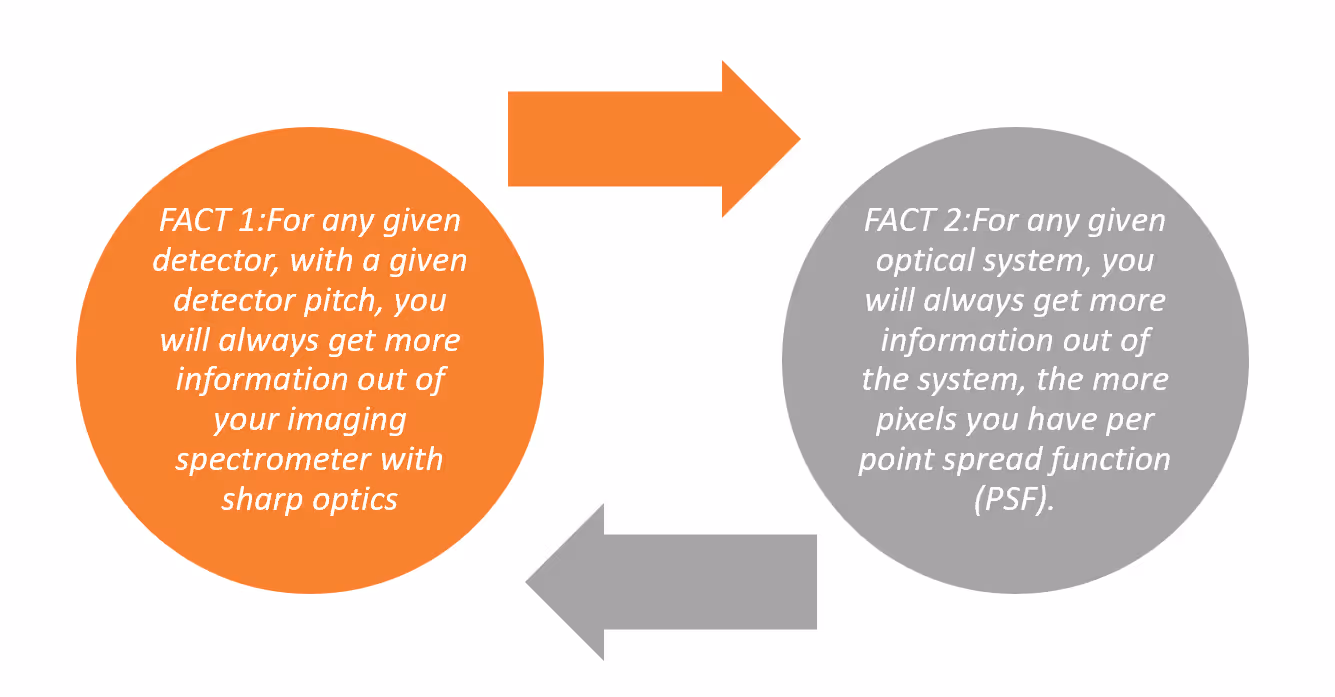
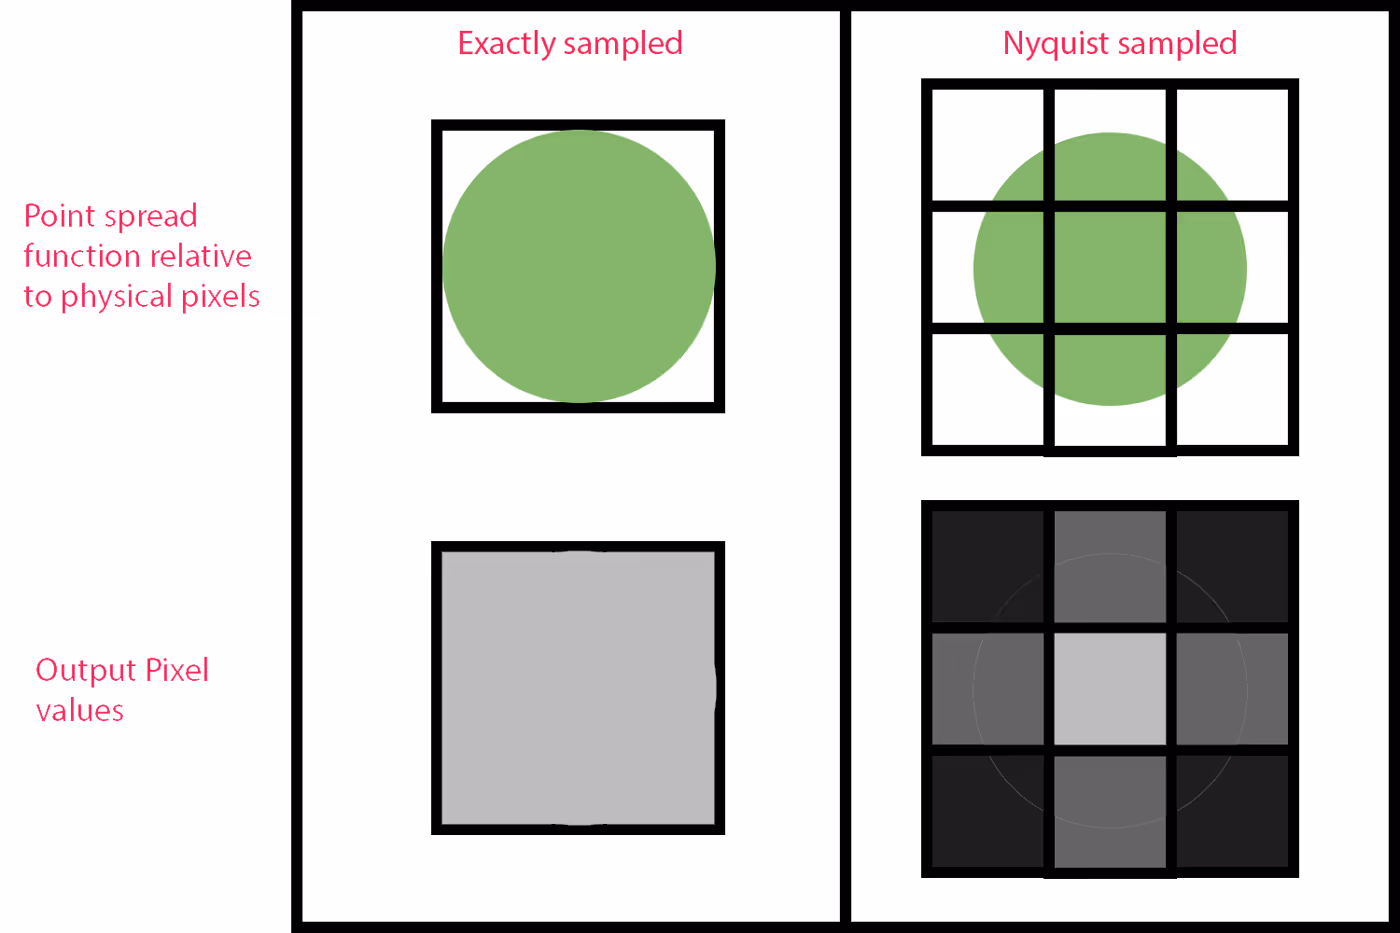
For any given optical system, you will always get more information out of the system, the more pixels you have per point spread function (PSF) (fact 2). When we come close to 2 bands FWHM in the spectral direction, HySpex has added an “N” to the name telling the user that this system has close to 2 bands PSF. This is to distinguish between our extremely sharp camera and our Nyquist cameras (“N”). Nyquist theorem states that “data must be sampled at least twice per cycle in order to reproduce it accurately”. If we convert this to PSF thinking and pixels, it will be in this line: The PSF of any optical system should be sampled with at least two pixels in order to reproduce it accurately.
There are many trade-offs when deciding what system to make. HySpex currently offer one classic system that has the “N” added to the name; the VNIR-3000N.
Specification
Why we offer both Nyquist and non-Nyquist cameras
For UAV application we have made small imaging spectrometers for both VNIR and SWIR region, here you select a detector with small detector pitch and you have limited space and weight available. So here you have a detector chosen for the application and we make as sharp optics per pixel and per band as possible. Thus, our UAV systems are very sharp and they are not Nyquist cameras.
For our classical cameras that are generic and used for all different applications and all different platforms we have made optics for specific high-end detectors, then we have made extremely sharp optics per pixel and per bands with very low distortions. (VNIR-1800, VNIR-1024, SWIR-384). There are many applications where framerate is very important, when having a sharp system you will get the most amount of information per data rate, so then sharp systems are preferred.
For our VNIR-3000N camera, we have taken the imaging spectrograph for the VNIR-1800 camera that is made for 6.5um pixels and replaced the detector with the state-of-the-art detectors with 3.45um pixels. In this hyperspectral camera, we have better than 1.6 pixels spatial PSF for 3000 pixels and better than 1.8bands spectral PSF for 300bands. You can get data out in 600 bands as well. The max framerate of this system 117fps at full resolution.
Fact 1 tells you that you should have as sharp system as possible, but if you are making many different systems and you want to build model/algorithms that can be used on any of them despite where the center wavelengths are positioned, it would be good to have the system as a Nyquist camera spectrally to be able to reproduce the actual spectrum and make repeatable models and algorithms. That’s why for industrial cameras this would be a plus. But industrial cameras usually also need to be very fast, so the spectral PSF should not be more than 2 bands, because then that would compromise the amount of information you are getting per data rate.
As described in this post there are many trade-offs when deciding what kind of system to design, in general, we design systems to be really sharp per pixel and per band, and in some cases, we design Nyquist cameras for specific applications or specific platforms.
Whatever system you would use for your application, a good measure of the number of effective pixels of any camera is the number of spatial pixels used on the detector divided by the FWHM of the PSF in pixels. The same goes for the number of effective bands. It's always good to check this parameter for any camera you would use, this makes it also easier to compare cameras that have similar overall specifications on the datasheet. Here is a link to an article that is comparing two cameras with similar specifications but very different sharpness.


