Scientific Grade Quality

Obtaining scientific grade data from a UAV platform will require:
- High-end hyperspectral camera, featuring:
- Sharp optics and low distortions
- Low stray light
- Low F# optics (high throughput)
- Detector with high speed and low noise floor
- Good SNR across the full spectral range
- Stable and traceable calibration
- Stable Platform (Roll, pitch heading stabilization)
- High-performance INS and good boresight calibration for direct georeferencing
- Operational parameters
Many of these points are impossible to compare by simply comparing data sheets and brochures and requires a detailed investigation of real data, test reports or attending a live demo to make a relevant comparison of data quality and operational readiness.
High-end hyperspectral camera
It can be difficult to distinguish a high from a low-quality solution based only on standard marketing material. The following will elaborate on some quality parameters for hyperspectral cameras that are important to be aware of when choosing a sensor for a given application. Some points are generic for any hyperspectral camera, while others are specific for UAV applications.
Sharp optics and low distortions
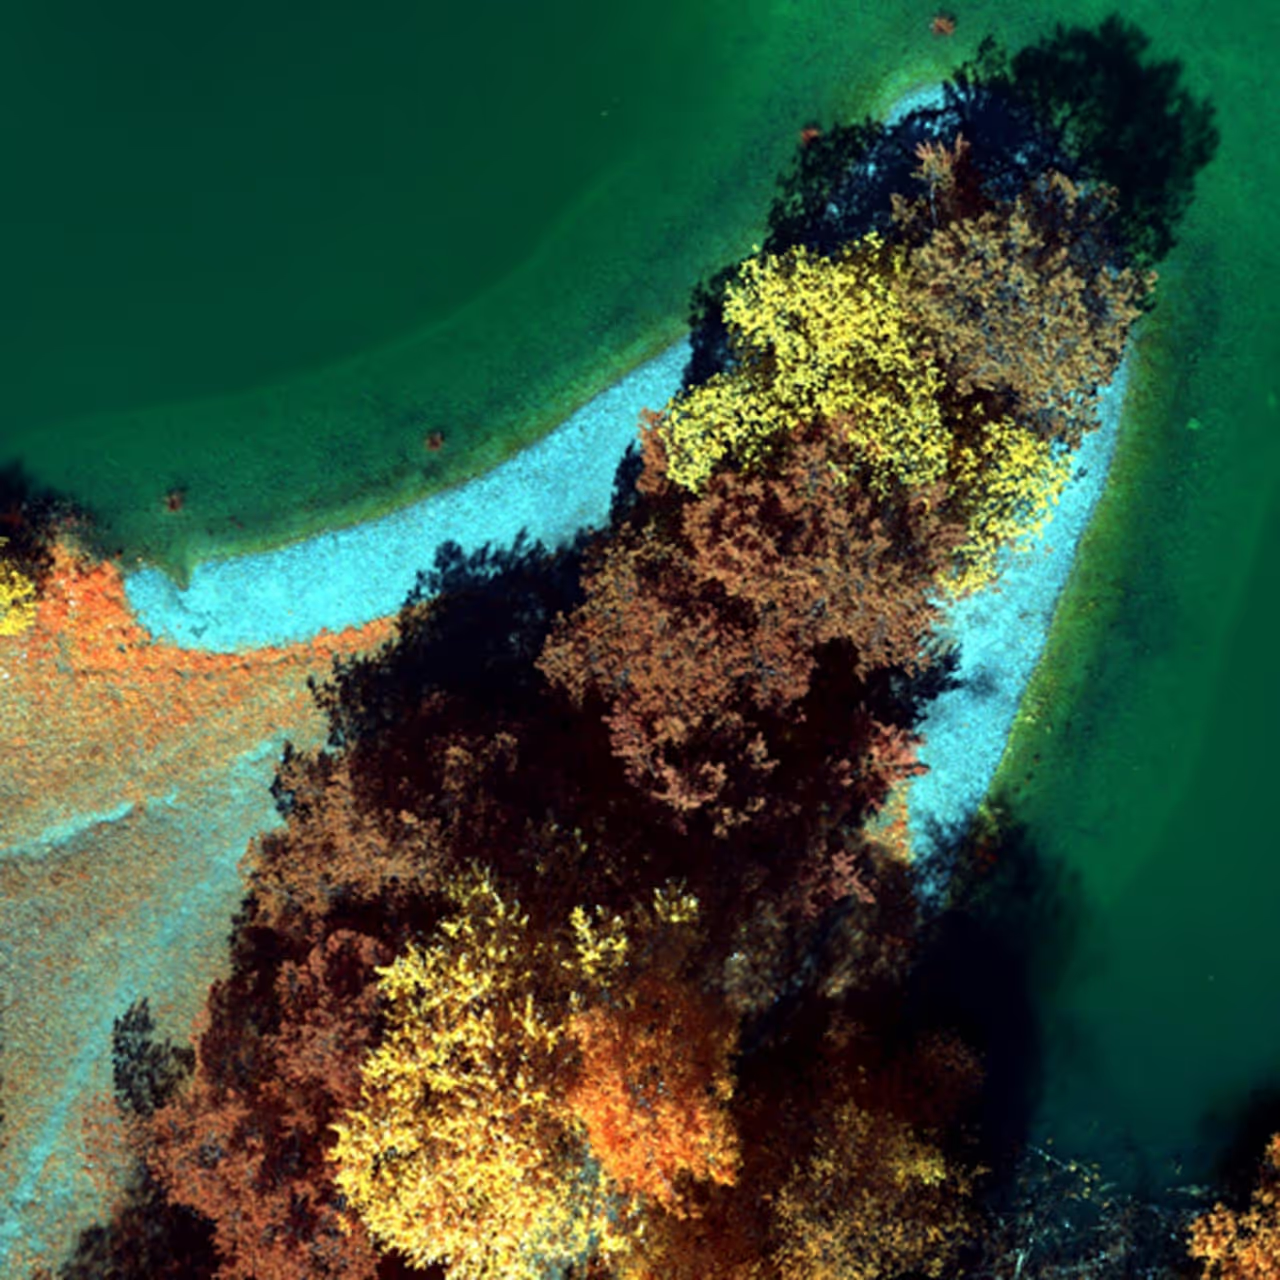
HySpex Mjolnir offers extremely sharp optics per pixel and per spectral band for both the VNIR and SWIR spectral range. The V-1240 has 1240 spatial pixels and 400 bands, and the spatial resolution (FWHM) is as low as 1.1 times the spatial sampling. Spectrally, the resolution (FWHM) at 400 bands is 1.5 times the spectral sampling across the whole FOV and spectral range, yielding extremely sharp images. With these specifications, the cameras have less than 10% of a band smile and less than 10% of a pixel keystone.
The S-620 has 620 spatial pixels and 300 spectral bands in the SWIR spectral range. The sharpness, keystone and smile effect is comparable or even better than the V-1240. The keystone and smile specifications of a hyperspectral system are some of the most important specifications of a hyperspectral camera. At the same time, they are among the parameters that get overlooked most frequently in a selection phase.
Keystone in a data set will generate unphysical spectra.
A camera, specified to have 1240 pixels should be expected to be able to record 1240 unique and correct spectral signatures – reproducing the real radiance from each pixel in the scene.
Some suppliers offer solutions specified to have 50% or more keystone. A camera with 50% keystone, will acquire data where 50% of the spectral signature in a given pixel originates from the pixel next to it. This is different from the linear mixture of two spectral signatures recorded by a pixel containing two different objects.
The keystone effect in the data will have some part of the spectral signature coming from one of the objects, while other parts of the spectra have a 50% influence from the object next to it – in essence generating an unphysical spectral signature. This effect will effectively reduce the spatial resolution, and larger objects are required to get one pure pixel. Keystone will also introduce effects like misidentification/classification or false alarms in your data product.
Detector with high speed and low noise floor
A small hyperspectral system will smaller pixel pitch on the detector than larger camera. This implies a smaller full well (charge capacity) on the detector pixels. In combination with having a high light throughput in the optics, it is also important to have a very low noise floor (read noise) on the detector. Lower noise floor means a higher dynamic range in the images.
As an example, the Mjolnir V-1240 has 2.3 electrons noise floor. Assume this system is mounted on a fixed-wing UAV flying at low altitude (i.e. short integration time), with a low sun angle yielding very challenging conditions with a lot of shadows. In the acquired data, the signal acquired from the shaded scene generates 24 photoelectrons in one pixel and band. Mjolnir V-1240, with the 2.3 electrons noise floor, will have an SNR of 10.43 for this signal. A noisier system, however, with e.g. 13 electrons read noise, will only have an SNR of 1.85, if all other parameters are identical.
Good SNR across the full spectral range
A smaller pixel pitch (to scale down the system size) means smaller full well, compared to systems with larger pitch. A smaller full well will give a smaller peak SNR. Peak SNR is approximately the square root of the full well if the noise floor is small. The full well of the detector used for V-1240 is about 10000 electrons, yielding a peak SNR of approximately 100 in the native sensor resolution. To get higher SNR, the dispersion in the camera covers more bands than the output cube. This is a good solution if the read noise is sufficiently low. For Mjolnir V-1240, 3.24 pixels are binned together, which effectively increase the full well with a factor 3.24. The peak SNR is thus about 180 at the full output resolution (1240 pixels x 400 bands). This will, of course, increase the readout noise; however, not more than approximately 4.14 electrons – which is still very good. The peak SNR alone is of limited use as it only indicates the maximum SNR obtained in a band that is close to saturation, but the total quantum efficiency of the whole system as a function of wavelength is also needed.
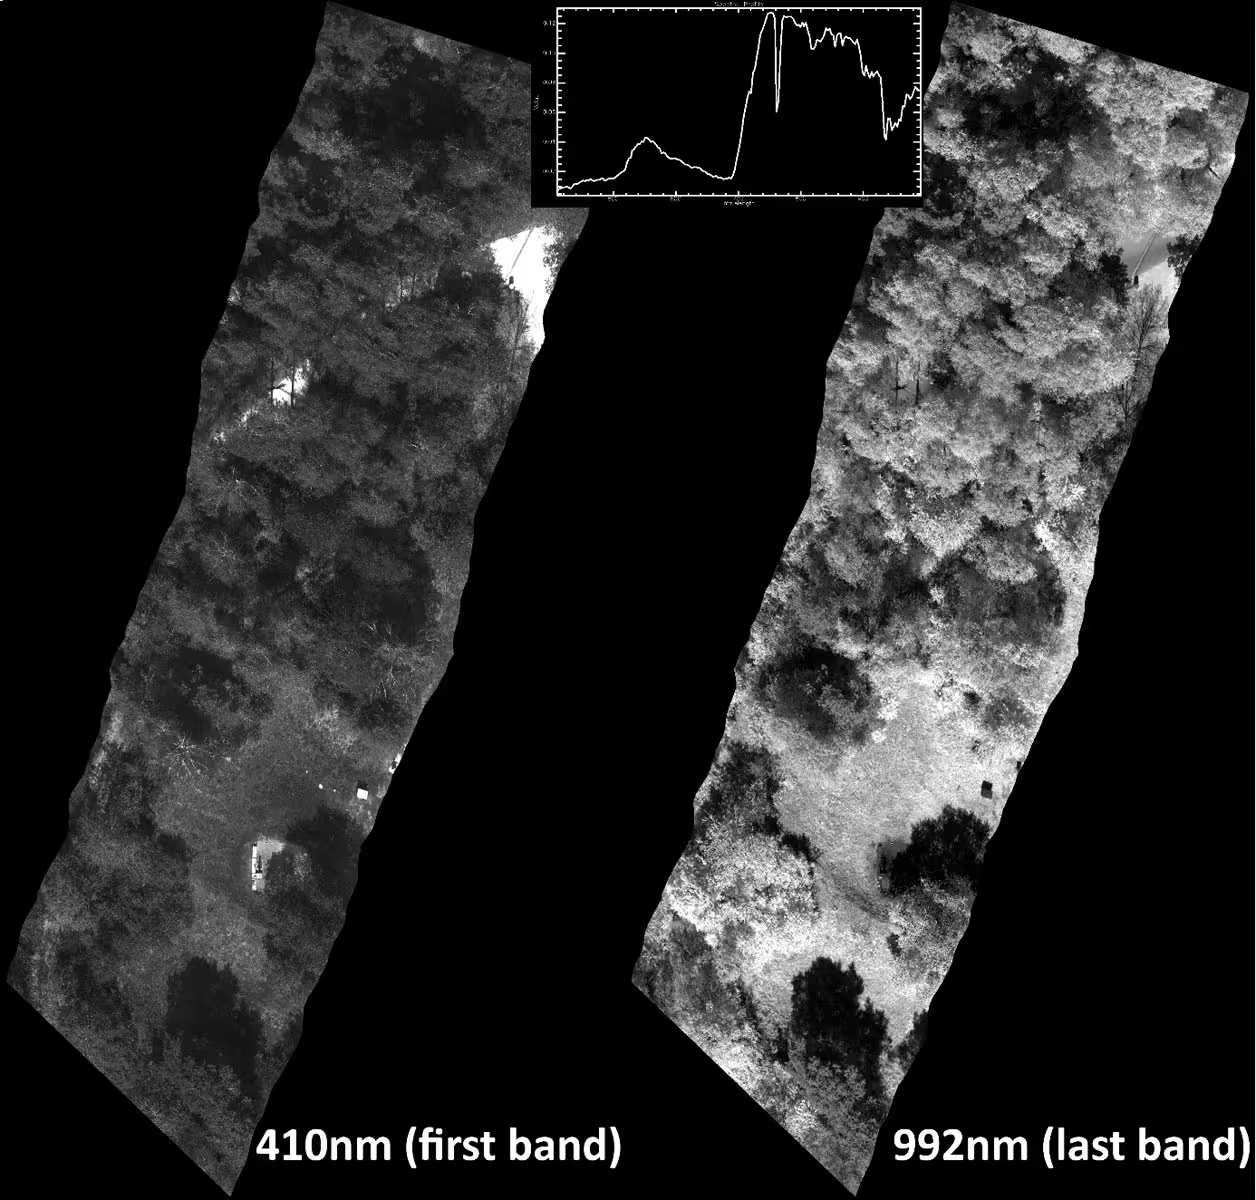
To obtain really useful information, the SNR curve needs to be specified for a given input radiance and a given (and operationally realistic) integration time. This information should be part of any test report for any system. A poorly designed system can be specified for the full range 400-1000nm, and have a decent peak SNR in the middle of the spectral range, but still, be unusable for several tens of nanometers at the start and end of the spectral range. A qualitative assessment of the SNR characteristics can be done by viewing single-band images at the edges of the spectral range of the system, as shown in the figure below.
Stable and traceable calibration
It is very important that the radiometric calibration is traceable to e.g. NIST or PTB standards, and the calibration procedures and standards used (including their accuracies) should be available for the users. To achieve good absolute orthorectification accuracies (on the order of the pixel size, i.e. ~2.7cm at 100m altitude for Mjolnir) the sensor manufacturer must supply a very precise sensor model as part of the calibration data. A precise sensor model is key for direct georeferencing.
Any hyperspectral system needs to maintain a stable and accurate radiometric and spectral calibration outside a controlled environment. A perfect calibration at the factory is worthless if this is not stable after transport and during operations. This means that the spectral, radiometric and geometric calibration must be stable with different temperatures, pressures and when exposed to heavy vibrations.
HySpex Mjolnir cameras are tested in a climate chamber from -20 degrees to +50 degrees. For the S-620 system, the FPA temperature is stabilized at 180K, since a low temperature is critical for the noise performance of MCT detectors. For VNIR cameras (using CMOS sensors) thermal effects on the sensor are also accounted for, ensuring accurate radiometric calibration, even when the ambient temperature varies. Each instrument produced also goes through a rough vibration test program to ensure that the system remains stable after leaving our facilities.
Stable Platform (Roll, pitch heading stabilization)
There are two main categories of UAV platforms:
- Rotor/copter solutions, and
- fixed-wing solutions.
There are some main advantages and disadvantages with both solutions that should be evaluated carefully when flying a pushbroom hyperspectral cameras:
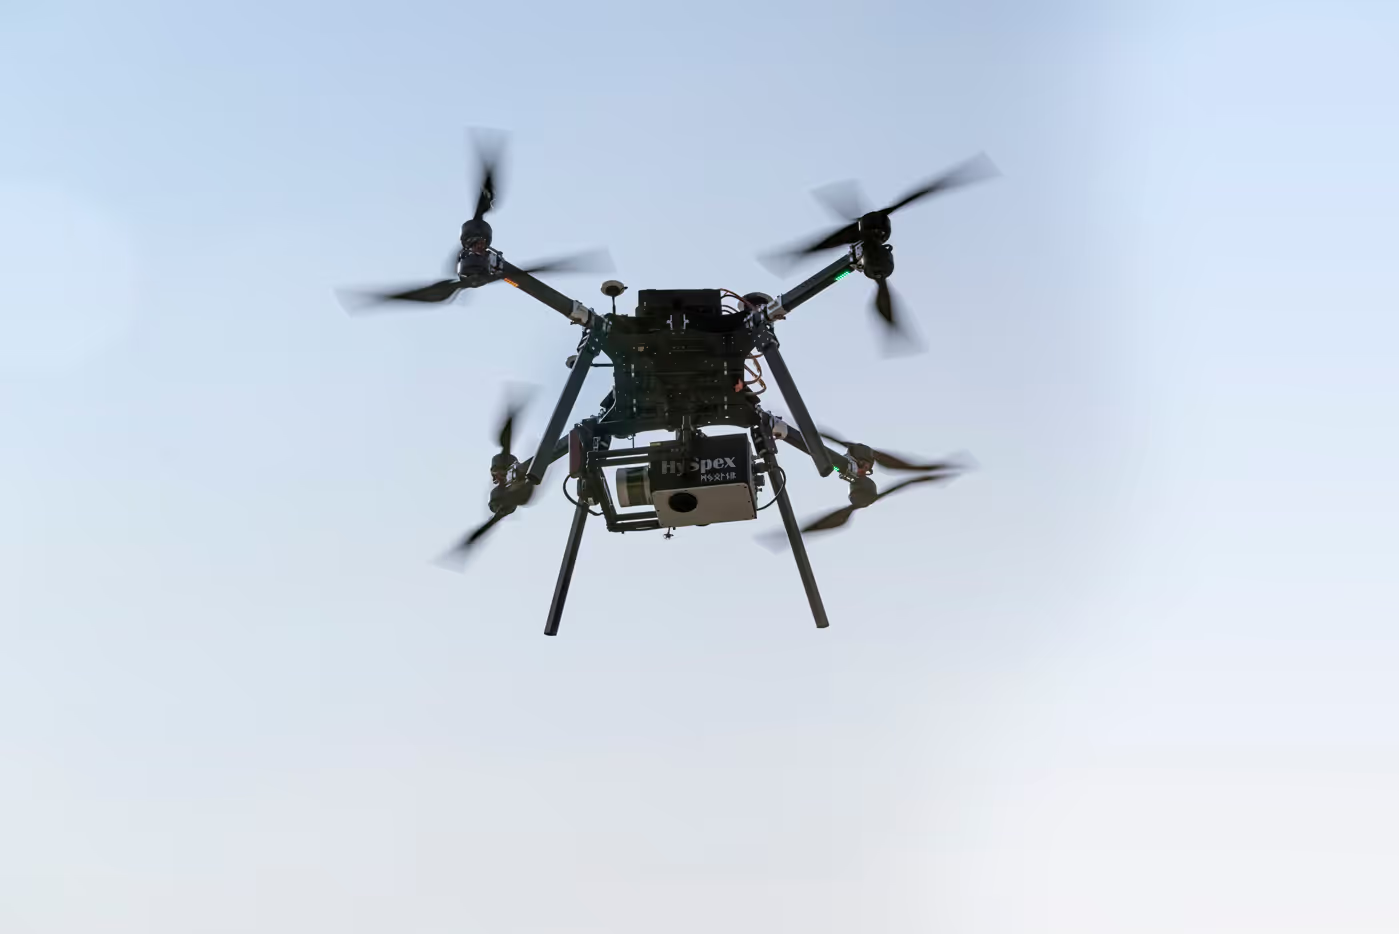
Copter solutions (usually octocopter) is a very good platform that gives the user full control of all the flight parameters. The altitude, speed, and direction can easily be adjusted, giving great flexibility optimizing integration time and frame rate. Copter solutions also require less logistics to fly than the fixed-wing solutions and usually can carry more payload compared to the overall size. However, rotary UAVs typically have a shorter flight time than the fixed-wing solutions. Another disadvantage is that the platform is exposed to significant vibrations during flight and that the system is doing a lot of high-frequency rolling and pitching to try to stay level. To compensate for this, a high-quality gimbal is recommended, which is illustrated in the figure below.
As is evident form the images above, a gimbal is highly recommended for a copter platform. Today there is no problem getting an octocopter platform that can carry the combined VNIR and SWIR solution (Mjolnir VS-620) with gimbal and being in total below the 25Kg limit and flying around 20-30 minutes. The Mjolnir solutions have been tested and integrated on several different platforms and our portfolio of qualified platforms is expanding. Integration on new platforms is generally straightforward. Fixed-wing solutions can usually fly relatively long, they are more stable when it comes to rolling and pitching and using a gimbal is not as important as for a copter solution. The disadvantages are that usually you often have very confined space for the payload and need more space for take-off and landing. Another limitation with fixed-wing solutions is the flight speed vs altitude. For the UAV to fly you usually need a speed of around 20-25m/s. If you are limited to for example max altitude of 150m above ground, you would need to run your system at very high frame rates which will basically limit the max integration time you can use and therefore also SNR in the images. For higher altitude flights with longer range and higher coverage requirements, the fixed-wing solution is more attractive.
High-performance INS and good boresight calibration for direct georeferencing
A common assumption or misunderstanding is that you need ground control points in every flight line to get good absolute position accuracies in the orthorectified images. This is not the case. If you have a very good geometric characterization (sensor model) and a stable system and a good INS you can do direct georeferencing with very high absolute position accuracies. To get good direct georeferencing results you need the following:
- High-performance INS system
- Good GPS antenna
- Avoid interference from motors/speed-controllers on the navigation system and antenna,
- Alignment of INS
- Accurate boresight calibration
- High-resolution DEM
- Mechanical stability between sensor and INS
- Accurate sensor model
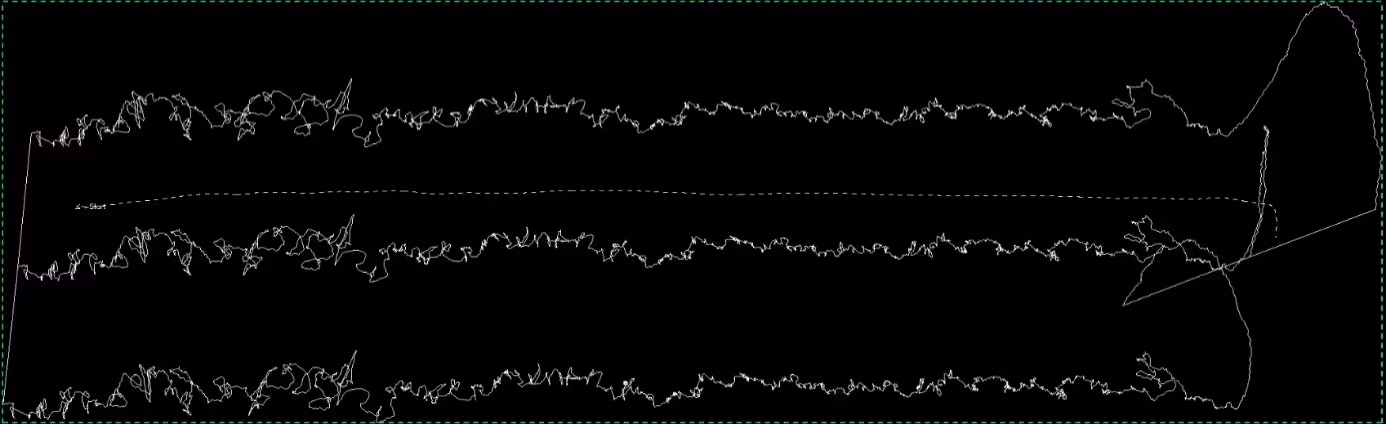
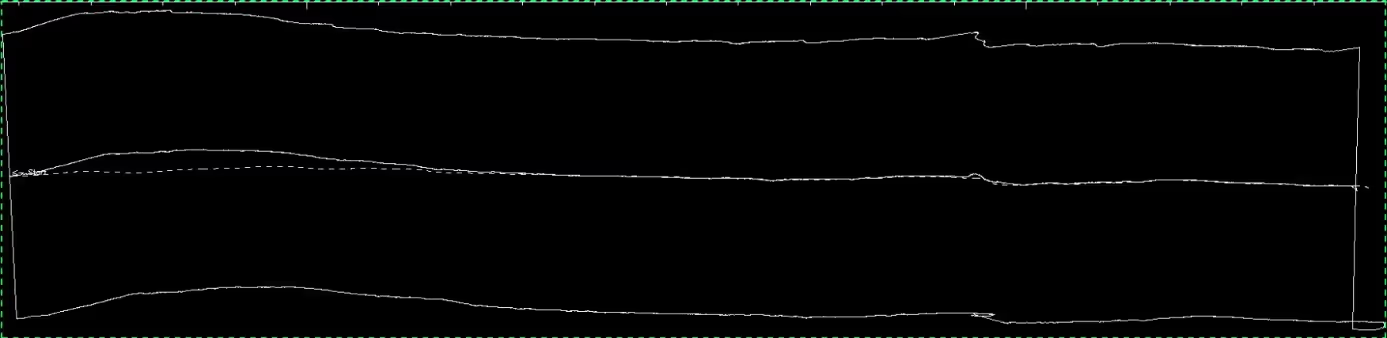
All HySpex UAV sensors are delivered with a precise boresight calibration, based on a boresight calibration flight near our premises. This means that when we deliver a system we have already defined the angles between the IMU coordinate system and the camera coordinate system so that the INS data is already transformed to the camera coordinate system. To do this we do a very accurate boresight calibration flight over and area with 50 well-defined GCPs. Here is an example of such a boresight calibration image from the V-1240 taken at ETH in Zurich.
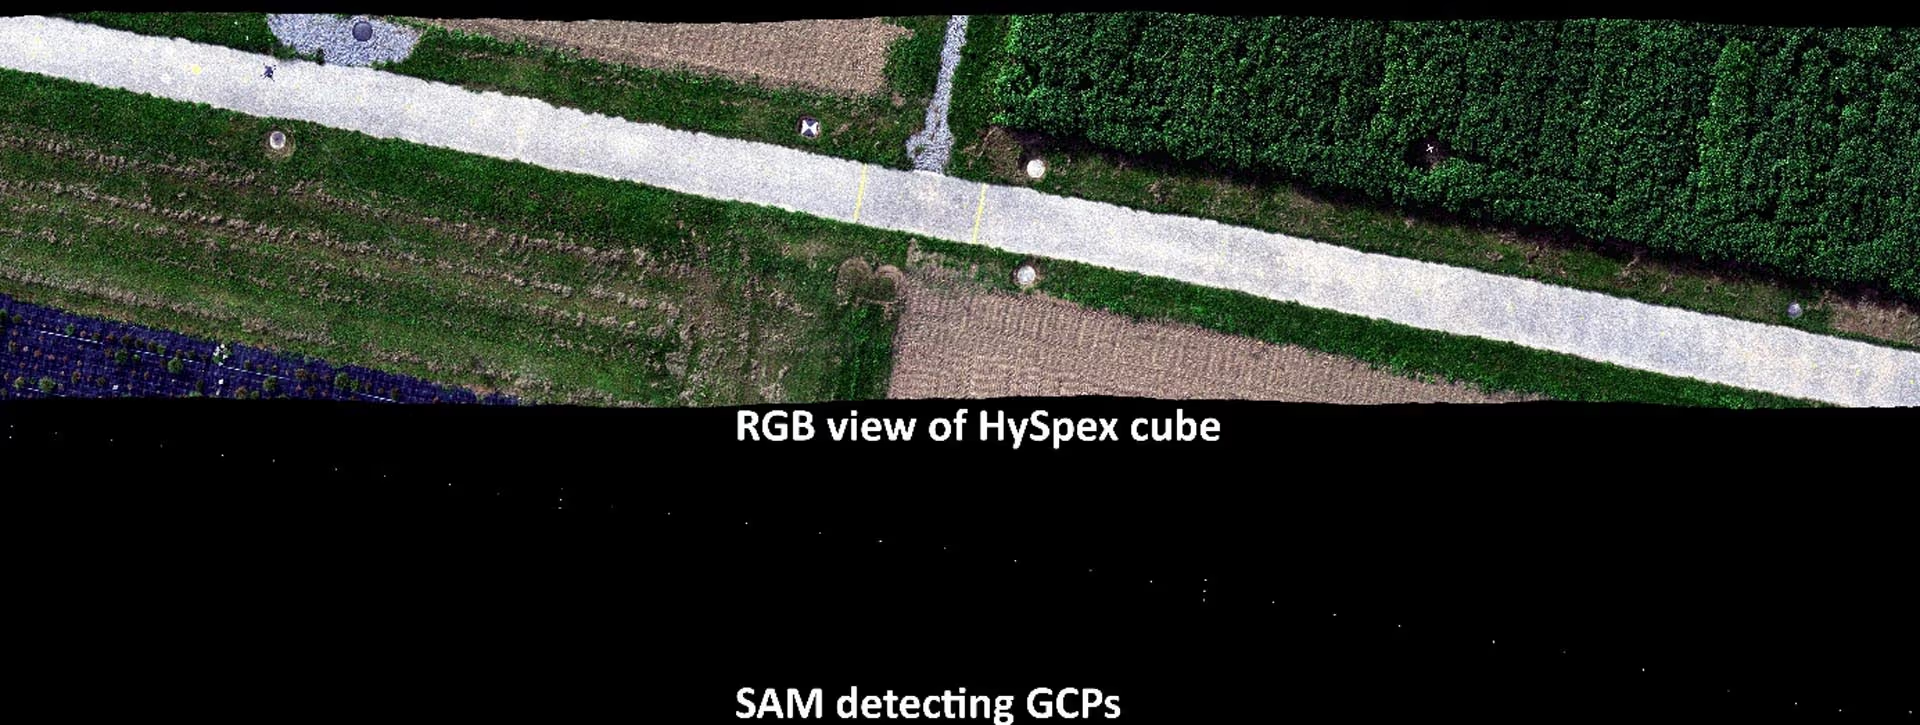
This is an optimal layout of the boresight site. There are yellow markings on the road that are measured with a DGPS with around 2cm accuracies in X and Y and 5cm in Z. As you can see we have tilted the flight path so that the GCPs enters the FOV in the left side and exits the FOV in the right side. Since we have a hyperspectral camera, the yellow points can easily be detected automatically and that makes it easy to do the actual boresight calibration. For the site above we achieved 9mm accuracy in X and Y direction after rectification. As mentioned above you need a high-performance INS to do direct georeferencing with high accuracy. HySpex normally provides a fully integrated solution with the Applanix APX-15 UAV INS. Mjolnir systems can also be delivered without an internal INS solution (using your existing INS system) In this case, the only interface between Mjolnir and the external INS will be an event signal coming from the Mjolnir system to have full control of timing and synchronization.
Operational parameters and training
The Mjolnir system is a completely self-contained system including hyperspectral sensor, INS, high performance (i7) onboard computer, and link for remote control, with everything ruggedly mounted inside a single chassis with an easy interface to the selected gimbal solution. The ground station and SW give full control of all relevant sensor parameters as well as real-time previews on the ground station.
The system also has an external IO connector containing externally available 12V power, trigger, and a second event input. This makes it very easy to integrate with other hardware like an RGB camera, thermal camera, LIDAR, etc.
As for any system, you would need to operate the systems in the best way for your operational scenario to achieve the highest data quality. At NEO we always offer comprehensive training for the hyperspectral camera and the UAV operation. Different flight campaigns may have different sets of operational requirements (e.g. spatial resolution, size of the area) and it is very important that the user has a good tool to define the correct flight parameters to match the operational requirement. The tool must identify the correct parameters to get an optimal dynamic range and SNR in the images. A good training program and good tools for flight planning and optimization of camera parameters ensures that the user is able to operate the camera correctly and optimize the operational parameters (integration time, frame rate, flight speed, altitude, overlap, etc) in order to achieve the best SNR and overall data quality.


