
Hyperspectral analysis of powder mixtures
Characterization of composition and distribution
Characterization of composition and distribution
Mixing of powders and granular materials is a critical step in many different industries including the food, pharmaceutical, cosmetic, paper, plastic, and rubber industry. The selection of the optimal mixing procedure to achieve an even product quality is not straightforward. The mixing process will be affected by particle characteristics such as size, shape, density, and adhesion properties that may vary between different components in the same mix.
Good process and quality control require an assessment of both product composition and homogeneity. This is traditionally done by random sampling and lab analysis. To achieve detailed information about the homogeneity of each batch, a high sample frequency is required. By using hyperspectral imaging, sample composition and distribution can be measured directly in the batch in real-time covering a larger sample volume in a more time and cost-efficient manner. This also allows for the detection of impurities and their distribution within the powder.
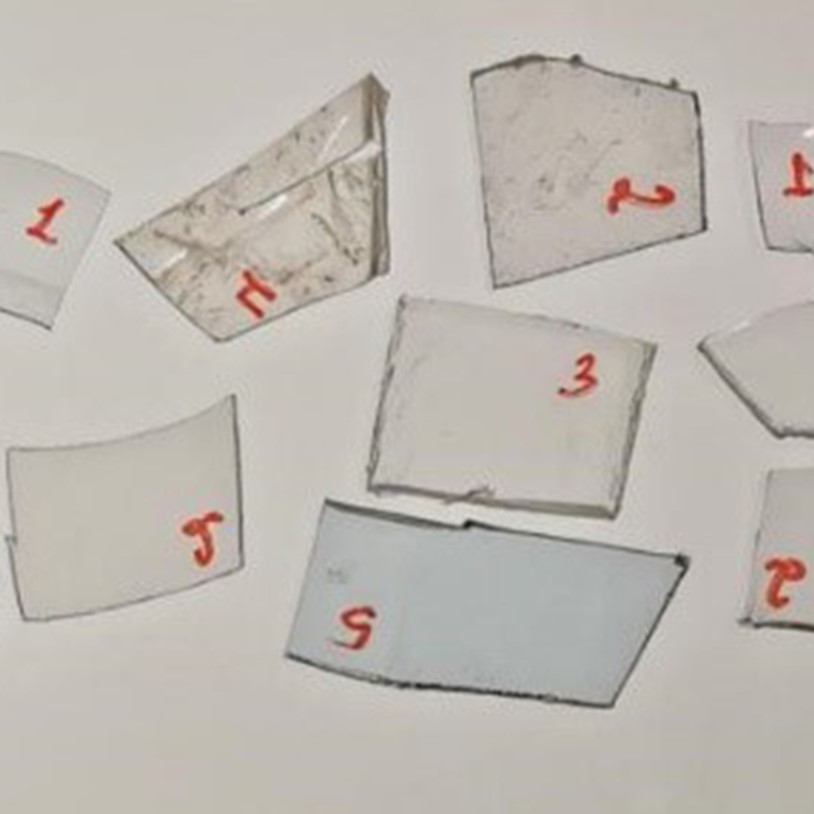
In this example, we will demonstrate how hyperspectral imaging can be used to measure the purity of a powder with 4 potential contaminants. The goal is to detect the purity of the base constituent independently of the type of contaminant. The data set was additionally used to show how hyperspectral imaging can be used to investigate sample homogeneity and to reveal poor mixing quality.
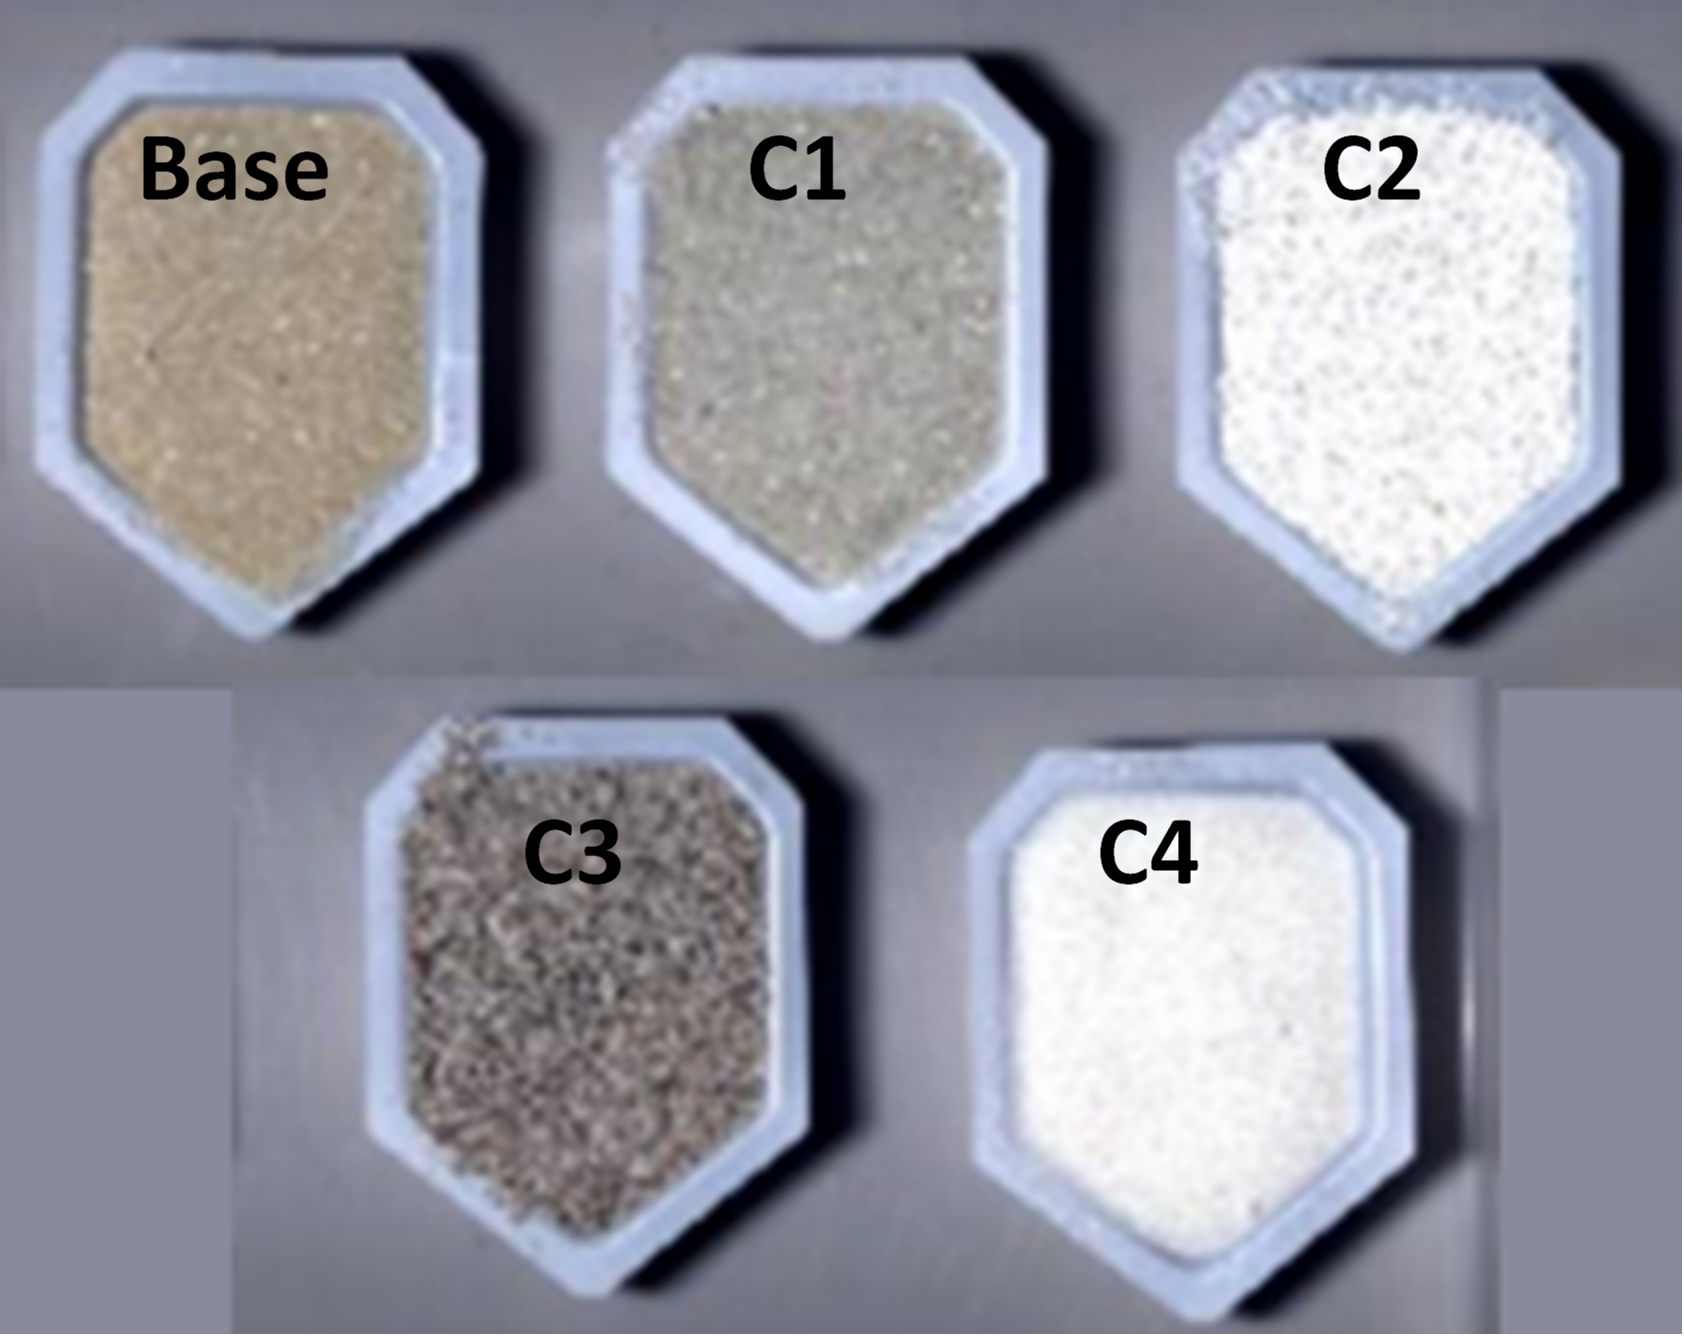
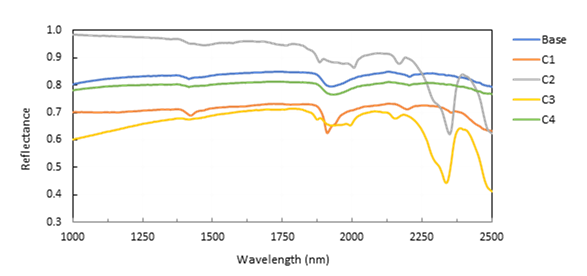
The different powders all exhibit unique spectral properties in the SWIR range, even though some of the powders show similar absorption features (Figure 3). The base shows similar spectral properties as C4, and there is also a high similarity between samples C2 and C3. To achieve a good separation, a good spectral resolution is therefore required.
The spectral differences were sufficient to create quantification models with acceptable errors for all 5 powders. The model quality assessment was based on the correlation coefficient of cross-validation (Q2) and the Root Mean Square Error of Cross-Validation (RMSECV). The models handling one contaminant at a time (Table 1) performed better than the global model (Table 2). The advantage with the global model is, however, that one can predict the content of the base, and hence the purity, without knowing the nature of the contaminant.
| Samples included in model | Q2 | RMSECV | Principal Components |
|---|---|---|---|
| C1 - series | 0.96 | 1.49 | 3 |
| C2 - series | 0.91 | 2.06 | 2 |
| C3 - series | 0.92 | 1.97 | 5 |
| C4 - series | 0.98 | 1.18 | 5 |
| All samples | 0.87 | 2.54 | 7 |
| Powder type modeled | Q2 | RMSECV |
|---|---|---|
| C1 | 0.95 | 1.12 |
| C2 | 0.93 | 1.27 |
| C3 | 0.89 | 1.63 |
| C4 | 0.78 | 2.35 |
| Base | 0.87 | 2.54 |
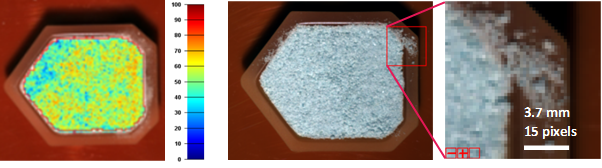
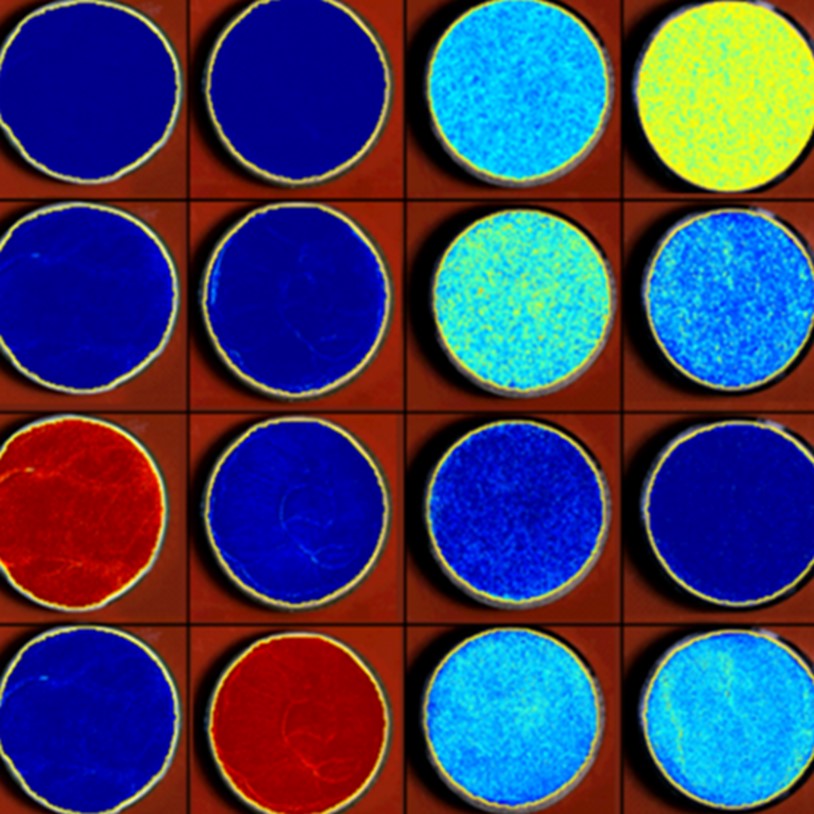
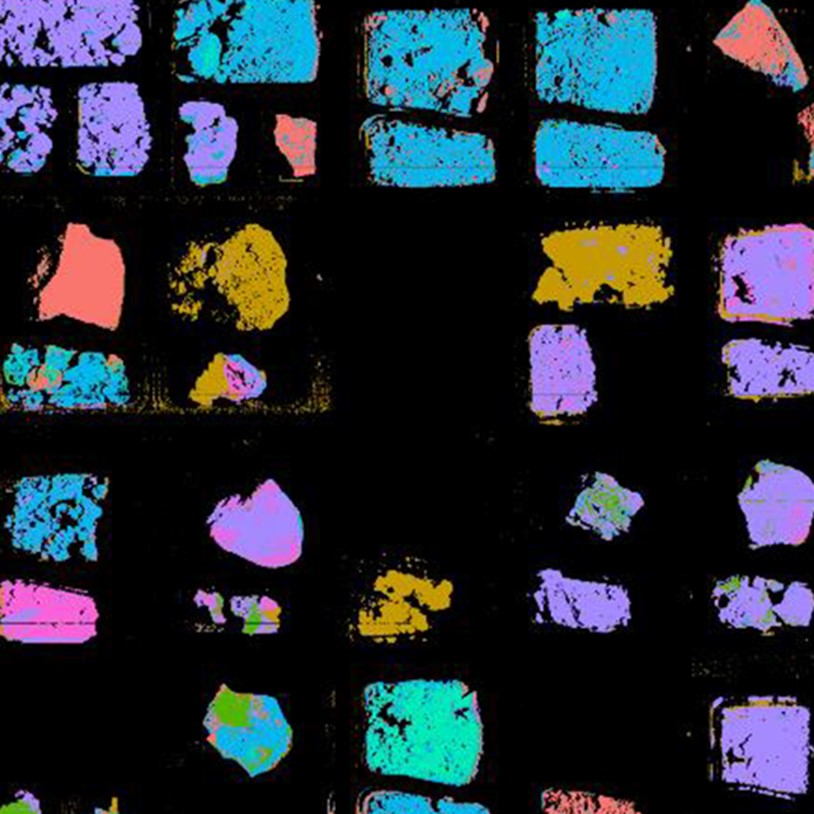
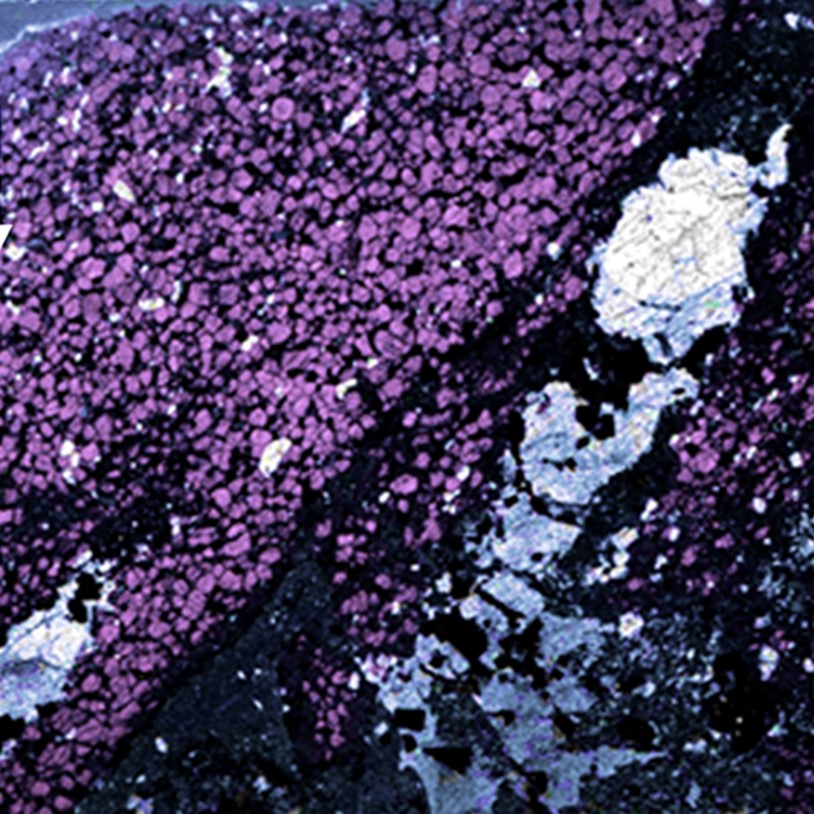
The models can be used to predict the content of the different powders in each pixel. This gives an image of how well the powders have been mixed (Figure 4). To get a good overview of the homogeneity of the powder mix, a high spatial resolution is recommended to be as close as possible to separate between individual grains.
This example shows that hyperspectral imaging can be used to predict the purity of powders without knowing the exact nature of the contaminant. Hyperspectral imaging can also be used to assess the mixing quality of powder mixtures given that the spatial resolution and the image quality is good. The HySpex cameras offer both superior spectral and spatial resolution with low smile and keystone effect.
Download this application note.

Pharmaceuticals
Methane Detection
Plastic Sorting
Mineral mapping in open pit mines

Asbestos
Explosives
Hyperspectral Imaging for Ore Distinction

Hyperspectral Analysis of Powder Mixtures

Paper Recycling
Rare Earth Elements

Coating thickness

Monument Preservation

Cocoa Beans