Mineral mapping in open pit mines
Hyperspectral Imaging for Mineral Identification
Hyperspectral Imaging for Mineral Identification
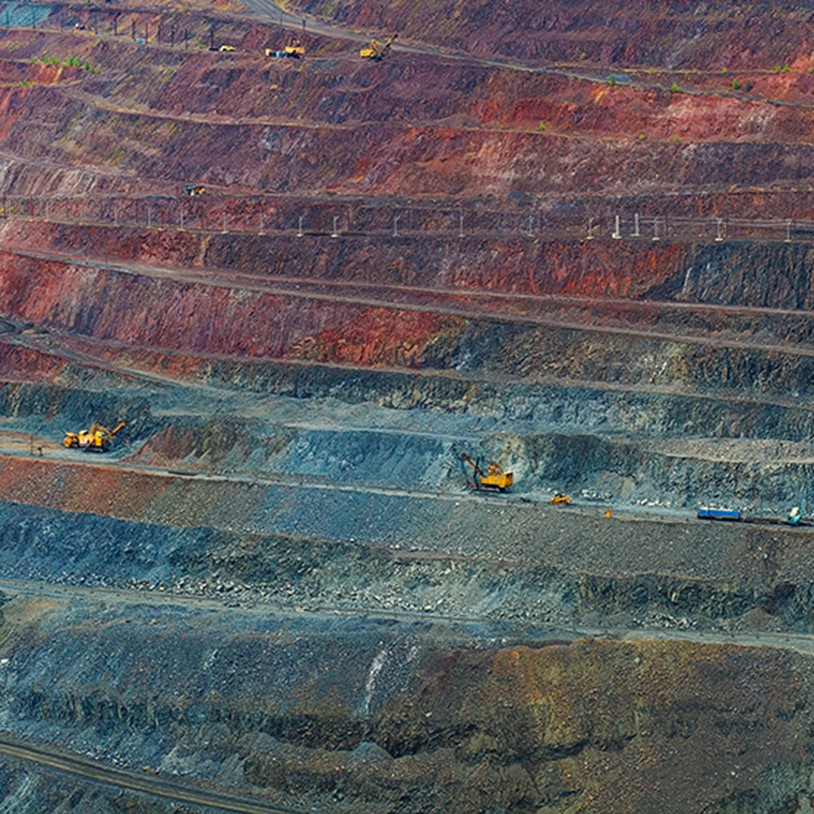
The material distribution within a mine face typically varies in the small scale and within daily assigned extraction segments. These changes are not always visually identifiable but are relevant for the ore quality from an extracted build and for adjusting the subsequent processing steps. Minimizing misclassifications or false allocations of material will minimize energy-intensive material re-handling. Imaging spectroscopy can help to identify and evaluate relevant minerals or deposit-specific geological materials before the extraction. It also allows for a streamlining of the extraction itself and the subsequent material transport to the processing facilities.
In this example, data from the former copper-gold-pyrite mine Apliki (Nicosia district, Republic of Cyprus) are used to illustrate the use of hyperspectral imaging for mineral identification on open-pit mines. The samples and onsite data were collected by the German Research Centre for Geosciences Potsdam (GFZ) and the University of Potsdam (UP) in cooperation with the Geological Survey Department of the Republic of Cyprus (GSD) during a field campaign in March 2018. The results and images presented here are part of the doctoral research by Koerting (2020).
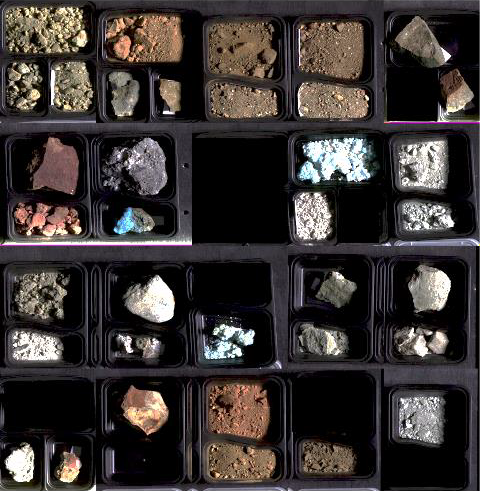
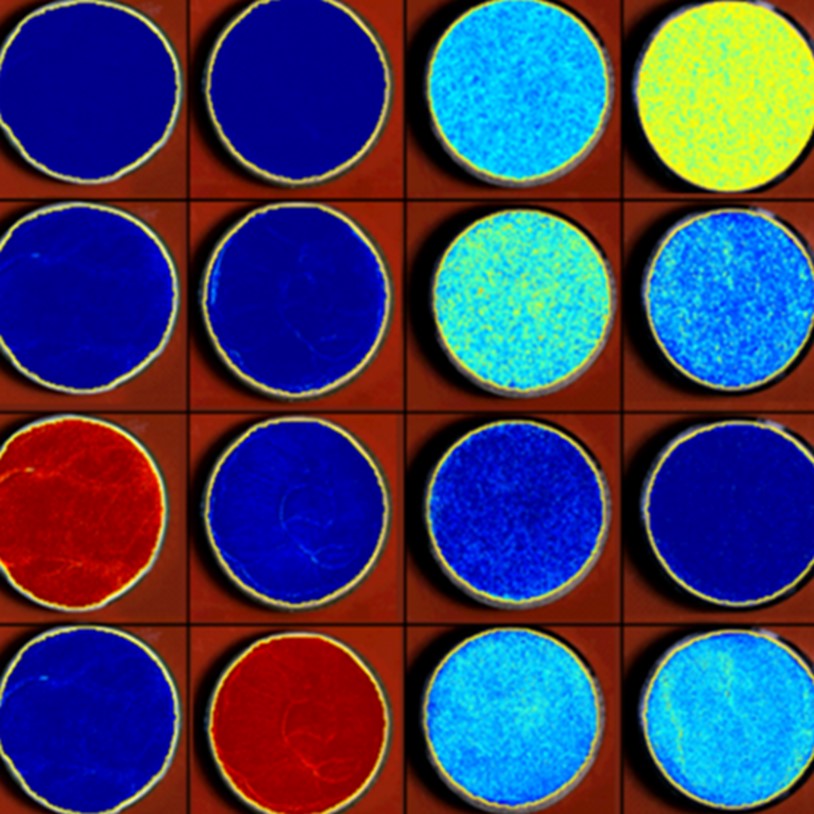
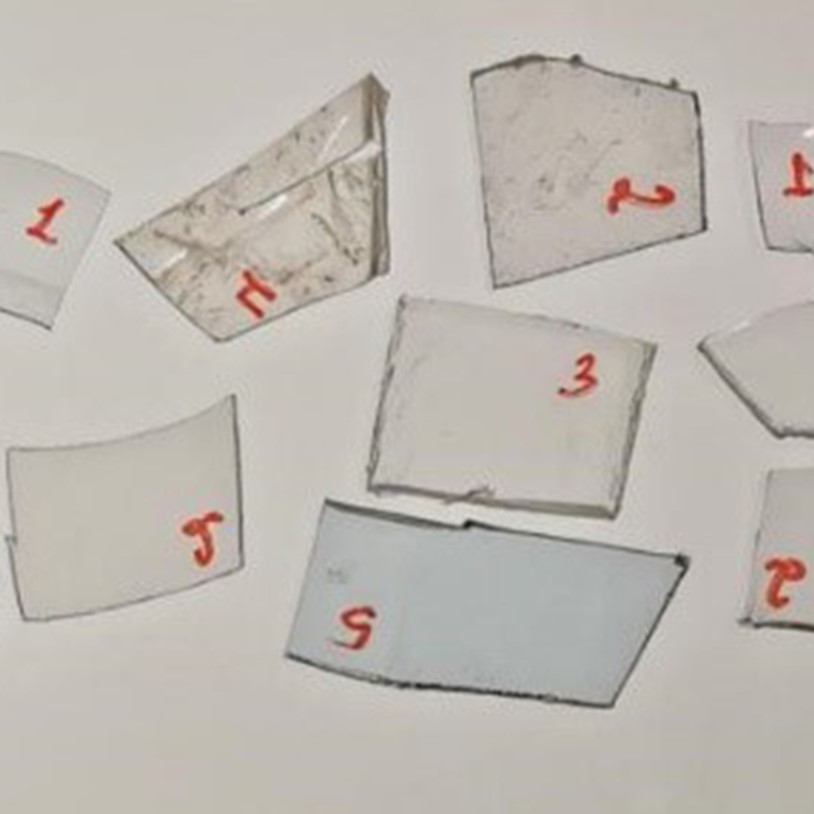
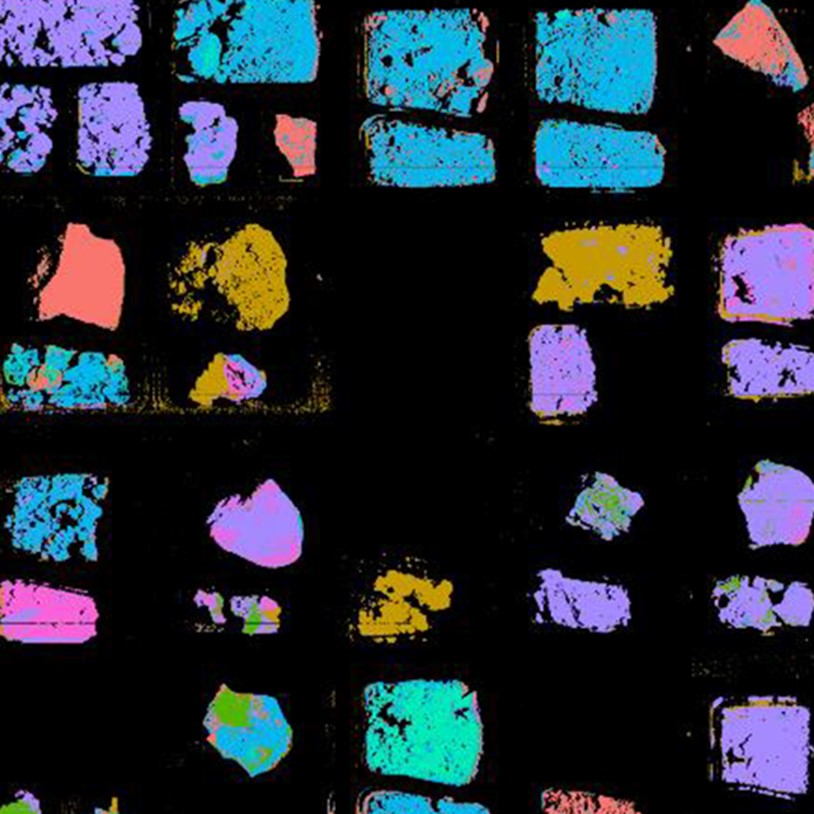
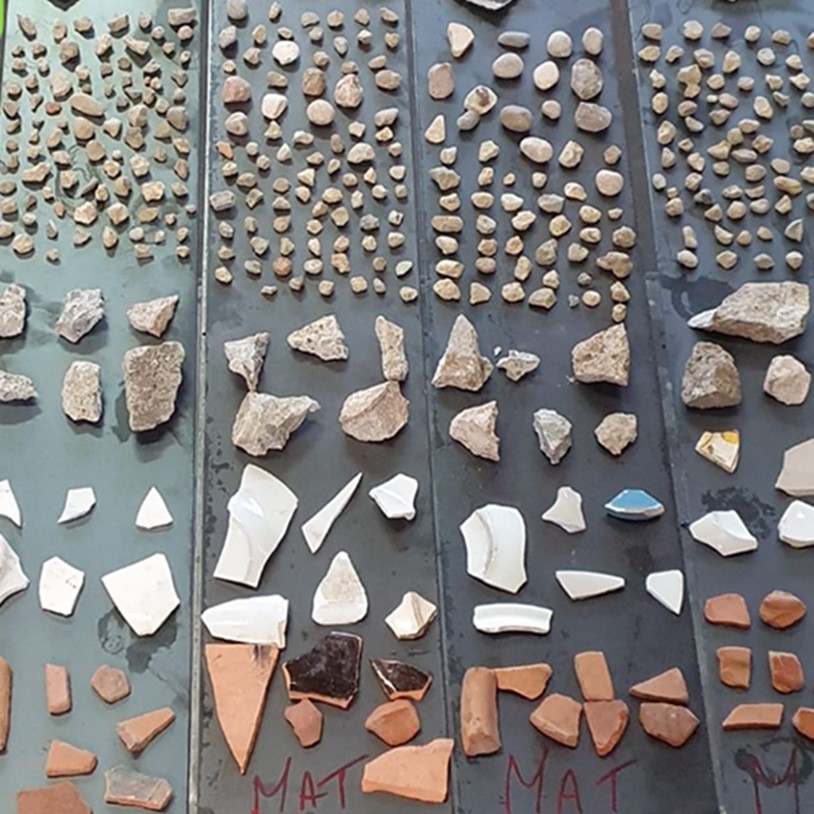
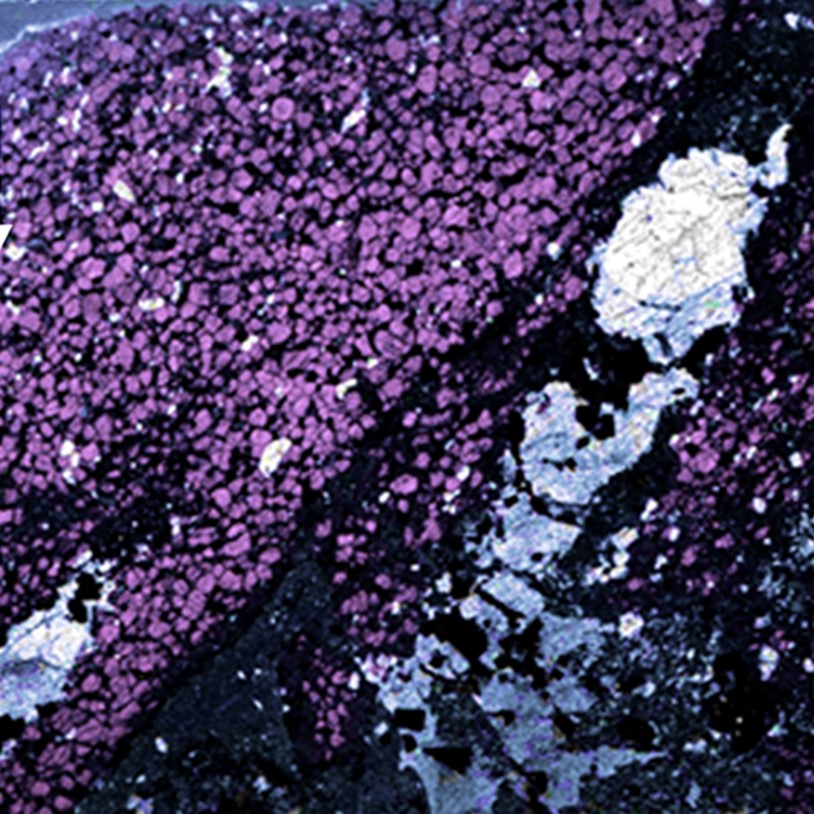
The geochemical data (ICP-ES & Carbon and Sulfur analysis) of 36 samples from the site were clustered. It identified seven different material groups. These groups were confirmed by evaluating the spectral fingerprints of the samples and by the dominant mineralogy (XRD). The site-specific spectral library (Fig. 1) shows one spectrum per cluster and was compiled in the laboratory from the 36 surface samples using VNIR and SWIR instruments from the HySpex Classic series.
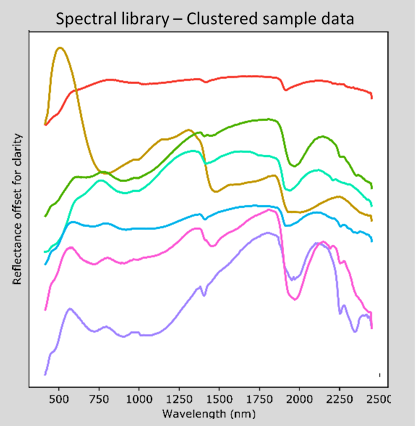
●C1 ●C2 ●C3 ●C4 ●C5 ●C6 ●C7
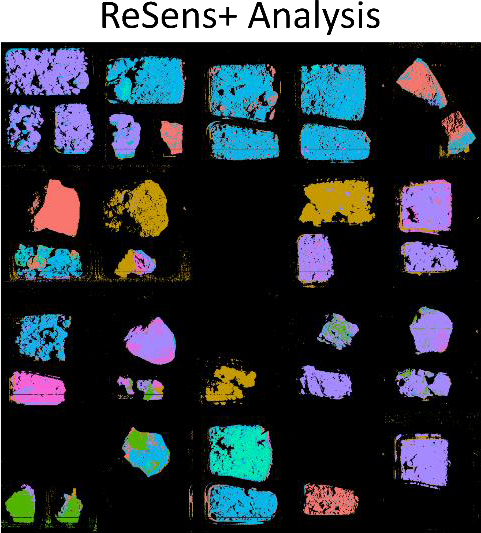
Figure 1. Sample-based spectral library. The 36 samples (left) collected onsite were analyzed and characterized in the laboratory using both hyperspectral and traditional means. The samples were then grouped in clusters according to their common geochemical data. The spectral library (center) was build using the reflectance from the clustered materials (C1-C7). The automated classification using ReSens+ (right) shows that the spectral cluster classes can be used to identify the samples. The library was later used to identify the materials/clusters on the mine face. ReSens+ is a software application by the German start-up rad. Data Spectral Analytic UG (limited).
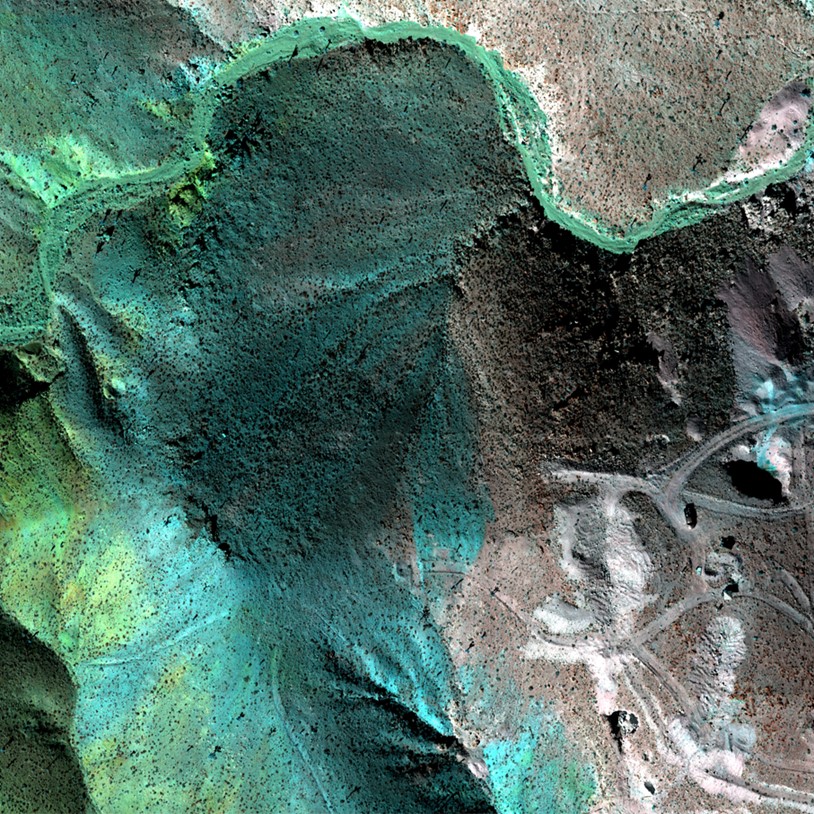
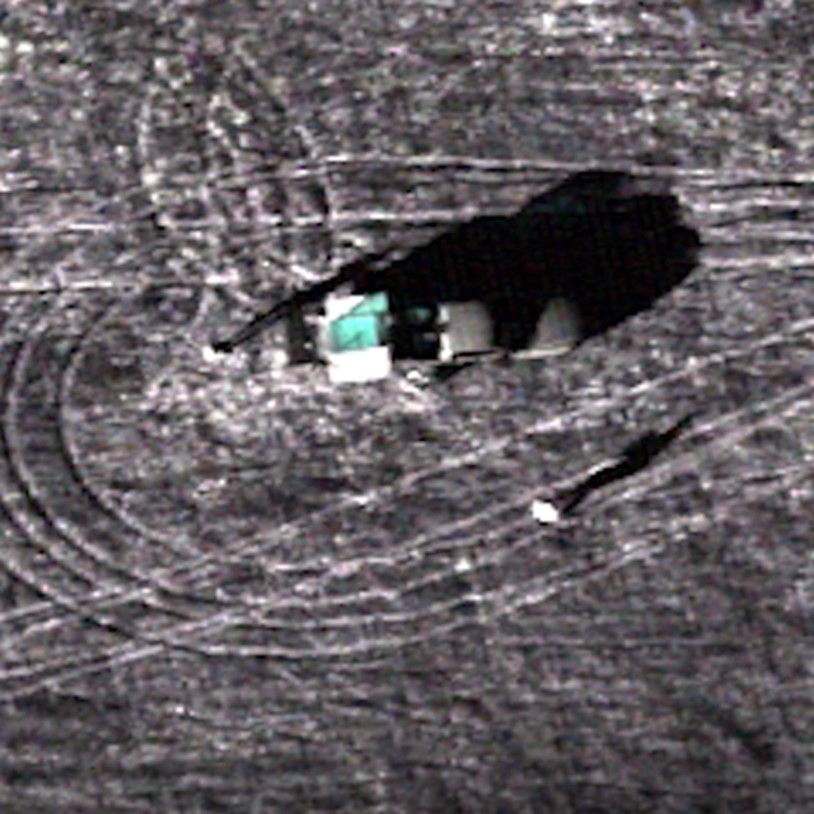
For the mine face classification, the input parameters used for analysis were reduced to six clusters by excluding the cluster dominated by gypsum. The resulting map (Fig. 2) highlights the location of the stockwork zone as well as the disseminated and weathered sulfide ore. Here, each cluster represents a different zone within the mine e.g. the mineralized pillow lavas, the smectitic-chloritic zone or the chloritic stockwork zone.
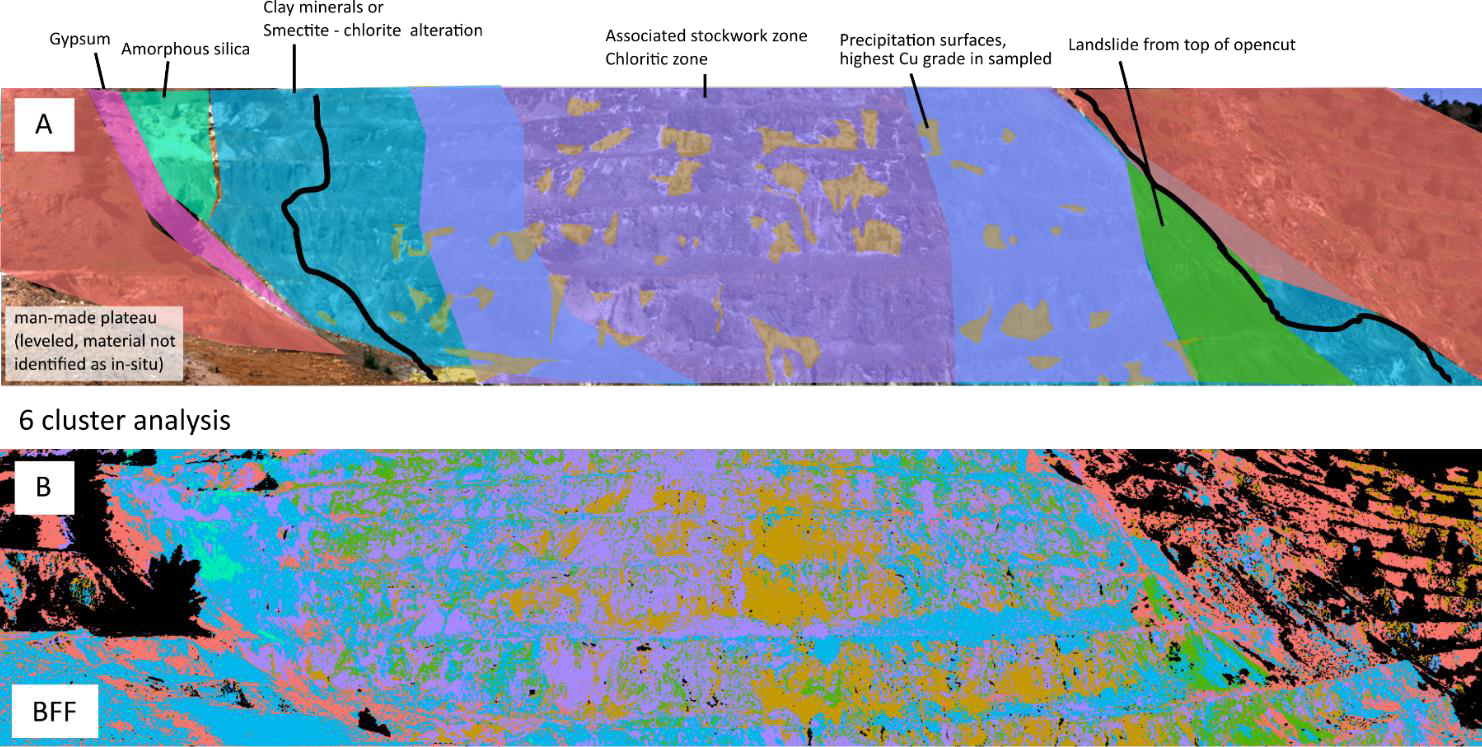
Cluster 1 – Apliki pillow lavas dominated by plagioclase and montmorillonite
Cluster 2 – Disseminated and weathered sulfide ore, dominated by quartz, sulfides and sulfates
Cluster 3 – Areas of higher silicification, jasper, quartz (+chlorite-group minerals)
Cluster 4 – Veins of massive mineralization, dominated by sulfates
Cluster 5 – Weathered pillow lavas, smectitic alteration, dominated by clay, smectite- chlorite-group minerals
Cluster 6 – Chloritic stockwork, dominated by chlorite-group minerals
Unclassified
Figure 2. A: Expected zonation of the mine faces (Antivachis, 2015). B: Hyperspectral mapping of Apliki mine face (Koerting 2020, in prep.) by the Binary Feature Fitting algorithm (Mielke et al, in prep.).
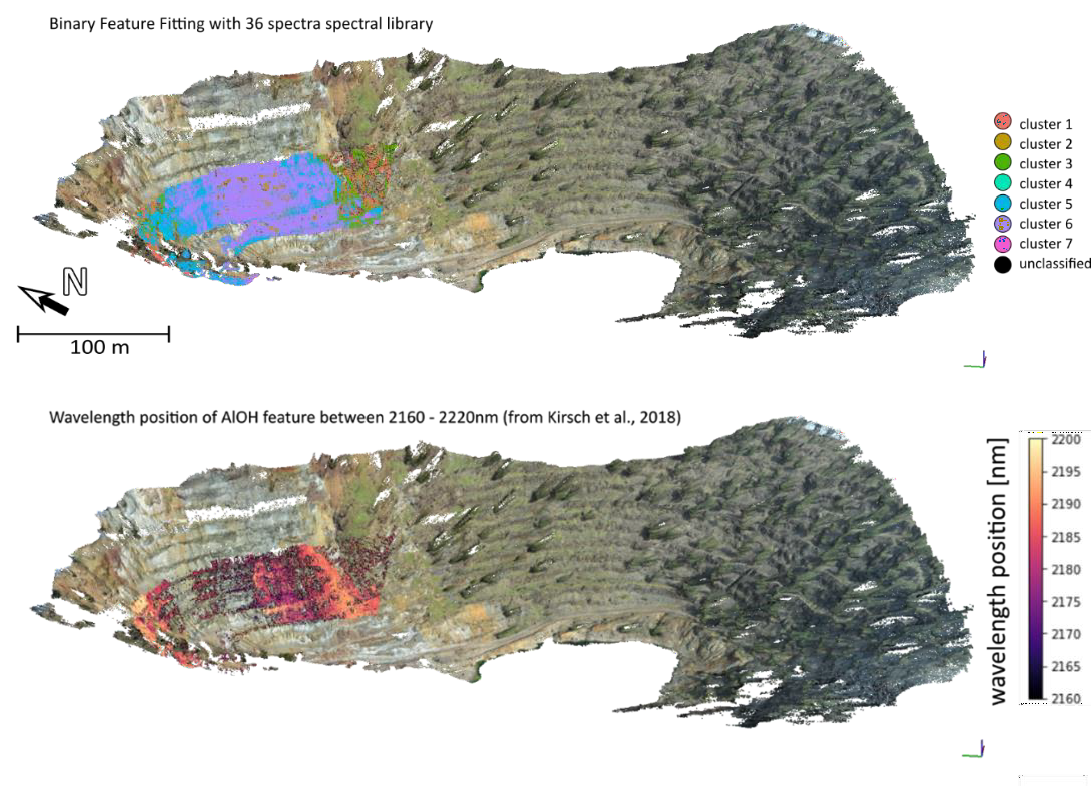
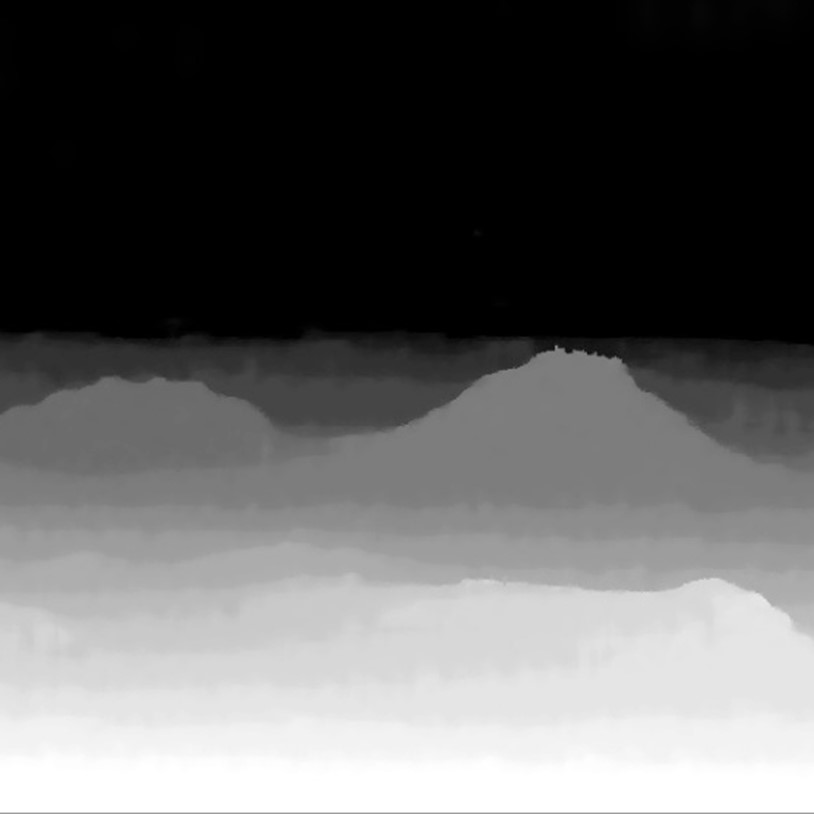
The hyperspectral map can be visualized on 3D models created by Structure-for-Motion (SfM) or by implementing precise LiDAR modeling (Fig. 3). These models help with the allocation of material onsite. Areas of e.g. high AlOH content can additionally be mapped by utilizing minimum wavelength mapping (Python HypPy Toolbox, Bakker and Oosthoek) for the AlOH feature defined at 2160 – 2220 nm by Kirsch et al. (2018). This type of analysis aids in identifying areas with higher contaminant levels (e.g. clay) to adjust the processing for the here extracted material.
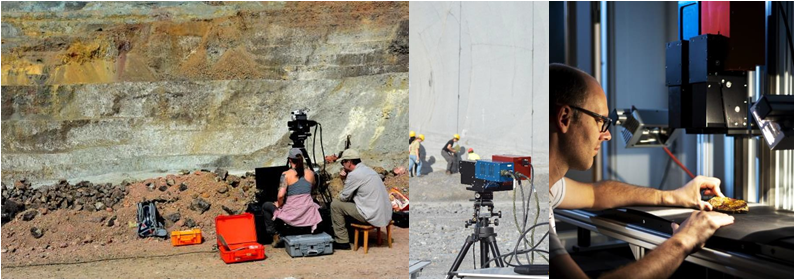
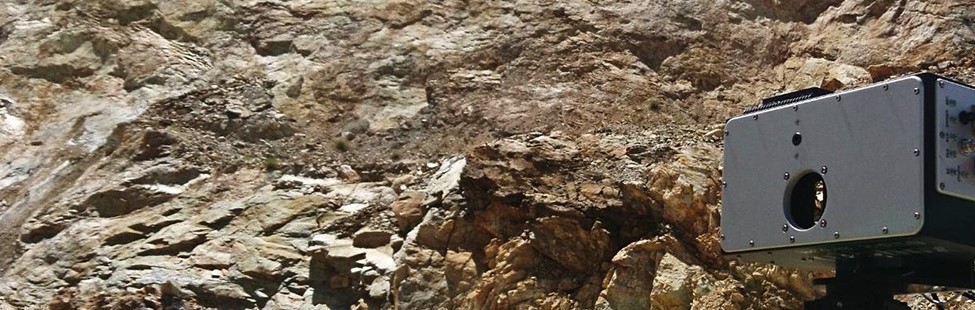
The hyperspectral data in this project was acquired using VNIR and SWIR cameras from the HySpex Classic series. The VNIR-1800 camera covers the 400 – 1000 nm range while the SWIR-384 operates in the 930 – 2500 nm range. The cameras have a spectral resolution of 3.3 and 5.5 nm, respectively.
The cameras are designed to operate in both the laboratory and the field, preserving the spectral fidelity needed for scientific and industrial applications thanks to their low- value optical aberrations, thermal stability, and custom lenses for a variety of working distances. The portable field system utilizes a battery-based, rugged data acquisition unit to power and control the cameras as well as the necessary moving stages.
The data analysis was performed with material classification algorithms primed by GFZ and advanced and distributed within the ReSens+ product family by rad.Data Spectral Analytics UG (limited), They provide fast, high- precision geoinformation about quality, quantity and location of minerals and materials across all hyper- and multispectral scales and platforms.
The example shows the potential of hyperspectral imaging as a tool for geological and mining applications. Its use allows for precise identification of minerals and materials anywhere from exploration and mining to processing and manufacturing. HySpex offers a varied selection of turn-key solutions for scientific and industrial applications.
Data, results and images courtesy of:
Download this application note.
References:


Pharmaceuticals
Methane Detection
Plastic Sorting
Mineral mapping in open pit mines
Asbestos
Explosives
Hyperspectral Imaging for Ore Distinction

Hyperspectral Analysis of Powder Mixtures

Paper Recycling
Rare Earth Elements

Coating thickness

Monument Preservation

Cocoa Beans